Mon-Fri 7.30am-5pm
County Electrical Wholesalers Ltd
Search:

Blog

Most Efficient Solar Panels 2023

Jason Svarc

Most efficient solar panels comparison.jpg

Solar Panel Efficiency

Solar panel efficiency is a measure of the amount of sunlight (irradiation) that falls on the surface of a solar panel and is converted into electricity. Due to the many advances in photovoltaic technology over recent years, the average panel conversion efficiency has increased from 15% to well over 22%. This large jump in efficiency resulted in the power rating of a standard-size panel increasing from 250W to over 420W.

As explained below, solar panel efficiency is determined by two main factors; the photovoltaic (PV) cell efficiency, based on the cell design and silicon type, and the total panel efficiency, based on the cell layout, configuration and panel size. Increasing the panel size can also increase efficiency due to creating a larger surface area to capture sunlight, with the most powerful solar panels now achieving up to 700W power ratings.


Cell Efficiency

Cell efficiency is determined by the cell structure and type of substrate used, which is generally either P-type or N-type silicon. Cell efficiency is calculated by what is known as the fill factor (FF), which is the maximum conversion efficiency of a PV cell at the optimum operating voltage and current. Note cell efficiency should not be confused with panel efficiency. The panel efficiency is always lower due to the internal cell gaps and frame structure included in the panel area. See further details below.

The cell design plays a significant role in panel efficiency. Key features include the silicon type, busbar configuration, junction and passivation type (PERC). Panels built using high-cost IBC cells are currently the most efficient (21-23%) due to the high purity N-type silicon substrate and no losses from busbar shading. However, panels developed using the latest N-Type TOPcon, and advanced heterojunction (HJT) cells have achieved efficiency levels well above 22%. Ultra-high efficiency Tandem Perovskite cells are still in development but are expected to become commercially viable within the next two years.

Solar cell efficiency chart showing the projected cell efficiency increases from 2022 to 2025 - Image credit JA Solar

Panel Efficiency

Solar panel efficiency is measured under standard test conditions (STC) based on a cell temperature of 25°C, solar irradiance of 1000W/m2 and Air Mass of 1.5. The efficiency (%) of a panel is effectively calculated by dividing the maximum power rating, or Pmax (W) at STC, by the total panel area measured in square meters.

Solar_Panel_efficiency_formula_calculation.jpg

Overall panel efficiency can be influenced by many factors, including; temperature, irradiance level, cell type, and interconnection of the cells. Surprisingly, even the colour of the protective backsheet can affect efficiency. A black backsheet might look more aesthetically pleasing, but it absorbs more heat resulting in higher cell temperature, which increases resistance, this in turn slightly reduces total conversion efficiency.

The solar cell type, design and configuration all have an impact on panel efficiency

Panels built using advanced ‘Interdigitated back contact’ or IBC cells are the most efficient, followed by heterojunction (HJT) cells, TOPcon cells, half-cut and multi-busbar monocrystalline PERC cells, shingled cells and finally 60-cell (4-5 busbar) mono cells. 60-cell poly or multicrystalline panels are generally the least efficient and equally the lowest cost panels.


Top 10 Most Efficient Solar Panels *

The last two years have seen a surge in manufacturers releasing more efficient solar panels based on high-performance N-type HJT, TOPcon and IBC cells. SunPower Maxeon panels have led the industry for over a decade, but for the first time, lesser-known manufacturer Aiko Solar released the Black Hole series panels with an incredible 23.6% module conversion efficiency using a unique new ABC (All Back Contact) cell technology. LONGi Solar was only the second manufacturer to develop a module efficiency level of 22.8% with the new Hi-Mo 6 Scientists series. The Hi-Mo 6 series is based on a new hybrid IBC cell design, which LONGi calls HPBC. Canadian Solar has also revealed a new-generation Hi Hero module built using HJT cells, which is on par with the efficiency level of the renowned Maxeon series.

Other leading panels include those from Jinko, REC, Risen and Recom, featuring N-type HJT and TOPcon cells. High-performance panels from SPIC and Belinus using IBC cells have also closed the gap, plus new panels featuring multi-busbar (MBB) half-cut N-type TOPCon cells from JA Solar, Jolywood and Qcells and most leading manufacturers have helped boost panel efficiency up to 22%.

# Make Model Power Efficiency
1 Aiko Solar Black Hole series 460 W 23.6 %
2 SunPower Maxeon 6 440 W 22.8 %
3 Longi Solar Hi-Mo 6 Scientist 445W 22.8 %
4 Canadian Solar Hi Hero HJT 445 W 22.8 %
5 Jinko Solar Tiger NEO N-Type 440 W 22.5 %
6 Risen Energy Hyper-Ion HJT 440 W 22.5 %
7 Recom Tech Lion Series 425 W 22.4 %
8 REC Alpha Pure R 430 W 22.3 %
9 SPIC Andromeda 2.0 440 W 22.3 %
10 Qcells Q.Tron-G1+ 400 W 22.3 %

* Residential size panels - 54 to 66 cells (108-HC, 120-HC or 132-HC) and 96/104 cell formats. Does not include commercial panels greater than 2.0m in length.


Below is the latest Clean Energy Reviews downloadable chart of the most efficient residential solar panels for 2023, with PV cell technology details added for comparison.

* List of the most efficient solar panels announced and expected to reach high volume production during 2023 - Residential 54 to 66 cell format size panels only - Last update May 2023


Why Efficiency Matters

The term efficiency is thrown around a lot but a slightly more efficient panel doesn’t always equate to a better quality panel. Many people consider efficiency to be the most important criteria when selecting a solar panel, but what matters most is the manufacturing quality which is related to real world performance, reliability, manufacturers service, and warranty conditions. Read more about selecting the best quality solar panels here.


Faster Payback

In environmental terms, increased efficiency generally means a solar panel will pay back the embodied energy (energy used to extract the raw materials and manufacture the solar panel) in less time. Based on detailed lifecycle analysis, most silicon-based solar panels already repay the embodied energy within two years, depending on the location. However, as panel efficiency has increased beyond 20%, payback time has reduced to less than 1.5 years in many locations. Increased efficiency also means a solar system will generate more electricity over the average 20+ year life of a solar panel and repay the upfront cost sooner, meaning the return on investment (ROI) will be improved further.

Longer life and lower degradation

Solar panel efficiency generally indicates performance, especially as most high-efficiency panels use higher-grade N-type silicon cells with an improved temperature coefficient and lower power degradation over time. More efficient panels using N-type cells benefit from a lower rate of light-induced degradation or LID, which is as low as 0.25% of power loss per year. When calculated over the panel's 25 to 30 year life, many of these high-efficiency panels are guaranteed to still generate 90% or more of the original rated capacity, depending on the manufacturer’s warranty details. Due to the higher purity composition, N-type cells offer higher performance by having a greater tolerance to impurities and lower defects, increasing overall efficiency.

Solar panels with different efficiency - Trina 250W poly panel, 300W and 310W mono panels, 315W half-cut 120 cell, 335W multi-busbar and on the far right the high 20.8% efficiency 360W LG Neon R panel.

Solar panels with different efficiency - Trina 250W poly panel, 300W and 310W mono panels, 315W half-cut 120 cell, 335W multi-busbar and on the far right the high 20.8% efficiency 360W LG Neon R panel.

Area Vs Efficiency

Efficiency does make a big difference in the amount of roof area required. Higher efficiency panels generate more energy per square meter and thus require less overall area. This is perfect for rooftops with limited space and can also allow larger capacity systems to be fitted to any roof. For example, 12 x higher efficiency 400W solar panels, with a 21.8% conversion efficiency, will provide around 1200W (1.2kW) more total solar capacity than the same number of similar size 300W panels with a lower 17.5% efficiency.

  • 12 x 300W panels at 17.5% efficiency = 3,600 W

  • 12 x 400W panels at 21.8% efficiency = 4,800 W

Attention solar designers - Try our free string voltage calculator

Real-World Efficiency

In real-world use, solar panel operating efficiency is dependent on many external factors. Depending on the local environmental conditions these various factors can reduce panel efficiency and overall system performance. The main factors which affect solar panel efficiency are listed below:

  • Solar Irradiance (W/m2)

  • Shading

  • Panel orientation

  • Temperature

  • Location (latitude)

  • Time of year

  • Dust and dirt

The factors which have the most significant impact on panel efficiency in real-world use are irradiance, shading, orientation and temperature.

The power curves above highlight the relationship between irradiance and panel power output.

Solar Irradiance

The level of solar irradiance, also referred to as solar radiation, is measured in watts per square meter (W/m2) and is influenced by atmospheric conditions such as clouds & smog, latitude and time of year. The average solar irradiance just outside the Earth's atmosphere is around 1360 W/m2, while the solar irradiance at ground level, averaged throughout the year, is roughly 1000W/m2, hence why this is the official figure used under standard test conditions (STC) to determine the solar panel efficiency and power ratings. However, solar irradiance can be as high as 1200W/m2 in some locations during the middle of summer when the sun is directly overhead. In contrast, solar irradiance can fall well below 500W/m2 on a sunny day in winter or in smoggy conditions.

Shading

Naturally, if a panel is fully shaded, the power output will be very low, but partial shading can also have a big impact, not only on panel efficiency but total system efficiency. For example, slight shading over several cells on a single panel can reduce power output by 50% or more, which in turn can reduce the entire string power by a similar amount since most panels are connected in series and shading one panel affects the whole string. Therefore it is very important to try to reduce or eliminate shading if possible. Luckily there are add-on devices known as optimisers and micro-inverters, which can reduce the negative effect of shading, especially when only a small number of panels are shaded. Using shorter strings in parallel can also help reduce the effect of shading, as the shaded panels in one string will not reduce the current output of parallel unshaded strings.


Efficiency Vs Temperature

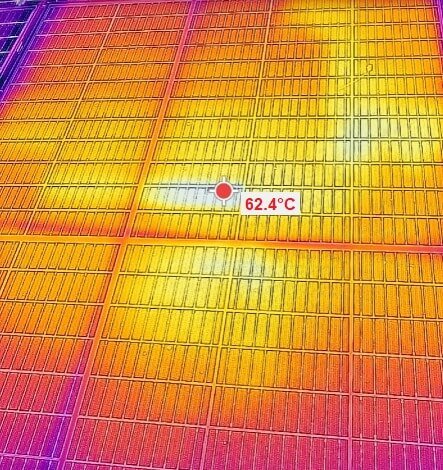
The power rating of a solar panel, measured in Watts (W), is calculated under Standard Test Conditions (STC) at a cell temperature of 25°C and an irradiance level of 1000W/m2. However, in real-world use, cell temperature generally rises well above 25°C, depending on the ambient air temperature, wind speed, time of day and amount of solar irradiance (W/m2). During sunny weather, the internal cell temperature is typically 20-30°C higher than the ambient air temperature, which equates to approximately 8-15% reduction in total power output - depending on the type of solar cell and its temperature coefficient. To provide an average real-world estimate of solar panel performance, most manufacturers will also specify the power rating under NOCT conditions or the Nominal Operating Cell Temperature. NOCT performance is typically specified at a cell temperature of 45°C and a lower solar irradiance level of 800W/m2, which attempts to approximate the average real-world operating conditions of a solar panel.

Conversely, extremely cold temperatures can result in an increase in power generation above the nameplate rating as the PV cell voltage increases at lower temperatures below STC (25°C). Solar panels can exceed the panel power rating (Pmax) for short periods of time during very cold weather. This often occurs when full sunlight breaks through after a period of cloudy weather.

The Power Temperature Coefficient

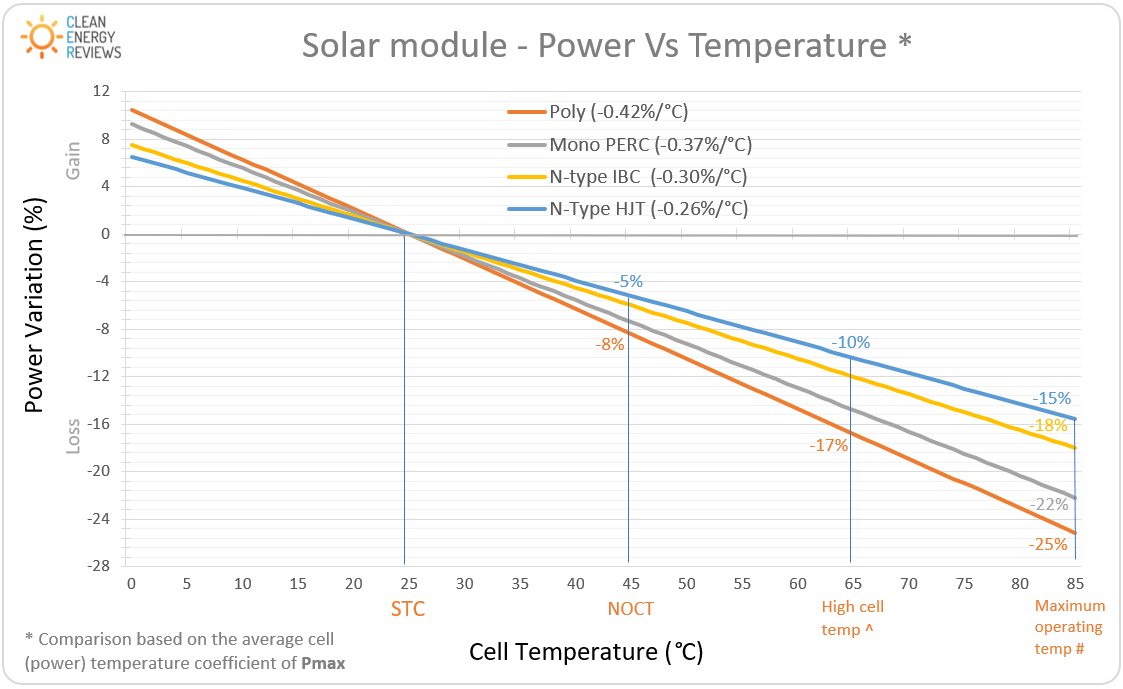
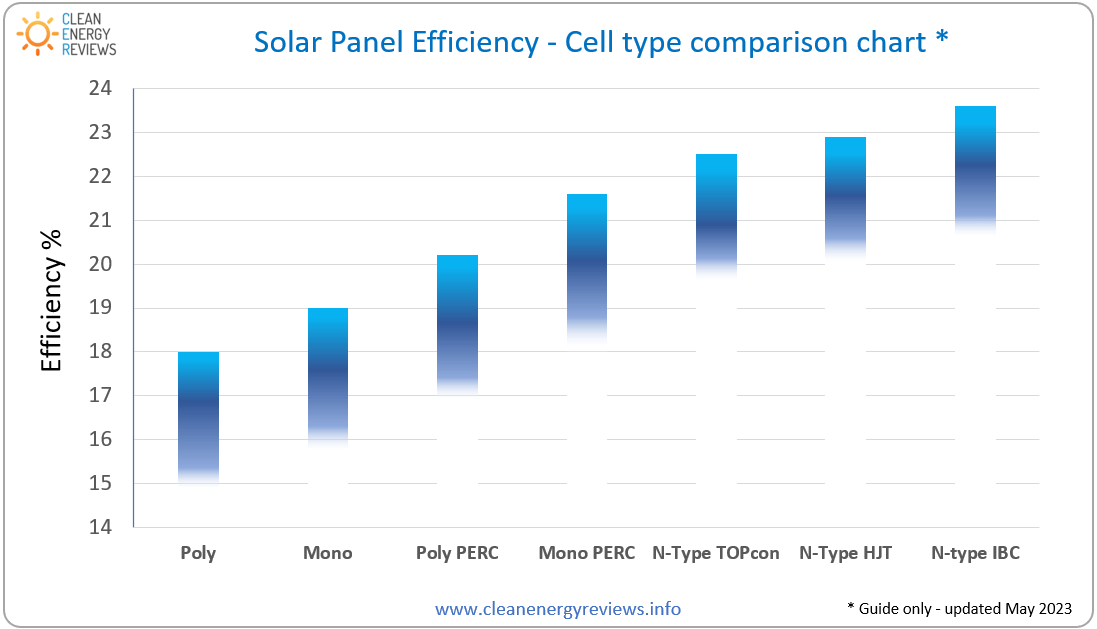
Cell temperatures above or below STC will either reduce or increase the power output by a specific amount for every degree above or below 25°C. This is known as the power temperature coefficient which is measured in %/°C. Monocrystalline panels have an average temperature coefficient of -0.38% /°C, while polycrystalline panels are slightly higher at -0.40% /°C. Monocrystalline IBC cells have a much better (lower) temperature coefficient of around -0.30%/°C while the best performing cells at high temperatures are HJT (heterojunction) cells which are as low as -0.25% /°C.

Temperature coefficient comparison

The power temperature coefficient is measured in % per °C - Lower is more efficient

  • Polycrystalline P-Type cells - 0.39 to 0.43 % /°C

  • Monocrystalline P-Type cells - 0.35 to 0.40 % /°C

  • Monocrystalline N-type TOPcon - 0.29 to 0.32 % /°C

  • Monocrystalline N-Type IBC cells - 0.28 to 0.31 % /°C

  • Monocrystalline N-Type HJT cells - 0.25 to 0.27 % /°C

The chart below highlights the difference in power loss between panels using different PV cell types. N-type heterojunction (HJT), TOPcon and IBC cells show far lower power loss at elevated temperatures compared to traditional poly and monocrystalline P-Type cells.

Solar panel Power Vs Temperature comparison chart for various cell types - Note, the cell (panel) temperature is typically 20 to 30 deg C above the ambient air temperature.

Power Vs Temperature chart notes:

  • STC = Standard test conditions - 25°C (77°F)

  • NOCT = Nominal operating cell temperature - 45°C (113°F)

  • (^) High cell temp = Typical cell temperature during hot summer weather - 65°C (149°F)

  • (#) Maximum operating temp = Maximum panel operating temperature during extremely high temperatures mounted on a dark coloured rooftop - 85°C (185°F)

Cell temperature is generally 20°C higher than the ambient air temperature which equates to a 5-8% reduction in power output at NOCT. However, cell temperature can rise as high as 85°C when mounted on a dark coloured rooftop during very hot 45°C, windless days which is generally considered the maximum operating temperature of a solar panel.


Most Efficient Solar Cells

The most efficient solar panels on the market generally use either N-type (IBC) monocrystalline silicon cells or other highly efficient N-type variations, including heterojunction (HJT) and TOPcon cells. Most manufacturers traditionally used the standard and lower-cost P-type mono-PERC cells; however, many large-volume manufacturers, including JinkoSolar, JA Solar, Longi Solar, Canadian Solar and Trina Solar, are now rapidly shifting to more efficient N-type cells using HJT or TOPcon cell designs.

Efficiency of panels using different cell types

  • Polycrystalline - 15 to 18%

  • Monocrystalline - 16.5 to 19%

  • Polycrystalline PERC - 17 to 19.5%

  • Monocrystalline PERC - 17.5 to 20%

  • Monocrystalline N-type - 19 to 20.5%

  • Monocrystalline N-type TOPcon - 21 to 22.6%

  • Monocrystalline N-type HJT - 21.2 to 22.8%

  • Monocrystalline N-type IBC - 21.5 to 23.6% **

** Several new variations of Interdigitated Back Contact (IBC) cell architectures have emerged, of which the exact cell construction has not been fully disclosed. This includes LONGi Solar’s Hybrid Passivated Back Contact (HPBC) technology and Aiko Solar’s ABC (All Back Contact) cell technology.

* Approximate average solar PV cell efficiency comparison chart - Mono and poly silicon types

Cost Vs Efficiency

All manufacturers produce a range of panels with different efficiency ratings depending on the silicon type used and whether they incorporate PERC, multi busbar or other cell technologies. Very efficient panels above 21% featuring N-type cells are generally much more expensive, so if cost is a major limitation it would be better suited to locations with limited mounting space, otherwise, you can pay a premium for the same power capacity which could be achieved by using 1 or 2 additional panels. However, high-efficiency panels using N-type cells will almost always outperform and outlast panels using P-type cells due to the lower rate of light-induced degradation or LID, so the extra cost is usually worth it in the long term.

For Example, a high-efficiency 400W+ panel could cost $350 or more while a common 370W panel will typically cost closer to $185. This equates to roughly $0.50 per watt compared to $0.90 per watt. Although in the case of the leading manufacturers such as Sunpower, Panasonic and REC, the more expensive panels deliver higher performance with lower degradation rates and generally come with a longer manufacturer or product warranty period, so it’s often a wise investment.


Panel Size Vs Efficiency

Panel efficiency is calculated by the power rating divided by the total panel area, so just having a larger size panel does not always equate to higher efficiency. However, larger panels using larger size cells increases the cell surface area which does boost overall efficiency.

Most common residential panels still use the standard 6” (156mm) square 60-cell panels while commercial systems use the larger format 72 cell panels. However, as explained below, a new industry trend emerged in 2020 towards much larger panel sizes built around new larger size cells which increased panel efficiency and boosted power output up to an impressive 600W.

Common Solar panel sizes

  • 60 cell panel (120 HC) : Approx width 0.98m x length 1.65m

  • 72 cell panel (144 HC) : Approx width 1.0m x length 2.0m

  • 96/104 cell panel: Approx width 1.05m x length 1.60m

  • 66 cell panel (132 HC) - Approx width 1.10m x length 1.80m

  • 78 cell panel (156 HC): Approx width 1.30m x length 2.4m

HC = half-cut cells

Solar-panel-efficiency-power-comparison.jpg

A standard size 60-cell (1m x 1.65m) panel with 18-20% efficiency typically has a power rating of 300-330 Watts, whereas a panel using higher efficiency cells, of the same size, can produce up to 370W. As previously explained, the most efficient standard-size panels use high-performance N-type IBC or Interdigitated Back Contact cells which can achieve up to 22.8% panel efficiency and generate an impressive 390 to 440 Watts.

Popular half-cut or split cell modules have double the number of cells with roughly the same panel size. A panel with 60 cells in a half-cell format is doubled to 120 cells, and 72 cells in a half-cell format have 144 cells. The half-cut cell configuration is slightly more efficient as the panel voltage is the same but the current is split between the two halves. Due to the lower current, half-cut panels have lower resistive losses resulting in increased efficiency and a lower temperature co-efficient which also helps boost operating efficiency.


New Larger cells and high power 600W+ panels

To decrease manufacturing costs, gain efficiency and increase power, solar panel manufacturers have moved away from the standard 156mm (6”) square cell wafer size in favour of larger wafer sizes. There are a variety of various cell sizes now available with the most popular being 166mm, 182mm and 210mm. The larger cells combined with new larger panel formats have enabled manufacturers to develop extremely powerful solar panels with ratings up to 700W. Larger cell sizes have a greater surface area and when combined with the latest cell technologies such as multi-busbar (MBB), TOPcon and tiling ribbon, can boost panel efficiency well above 22%.


Example Blog Post Two

Lorem ipsum dolor sit amet, consectetuer adipiscing elit. In condimentum facilisis quam. Duis sit amet metus nec metus molestie hendrerit. Nam sit amet odio. Nam mattis ultricies tellus. Duis ligula nibh, commodo eget, tristique condimentum, convallis sit amet, dui. Ut mauris sapien, vulputate ut, facilisis vel, ullamcorper id, elit. Lorem ipsum dolor sit amet, consectetuer adipiscing elit. In commodo sem non orci. Nulla ligula. Fusce condimentum blandit mi. Fusce nonummy. Vivamus ante.